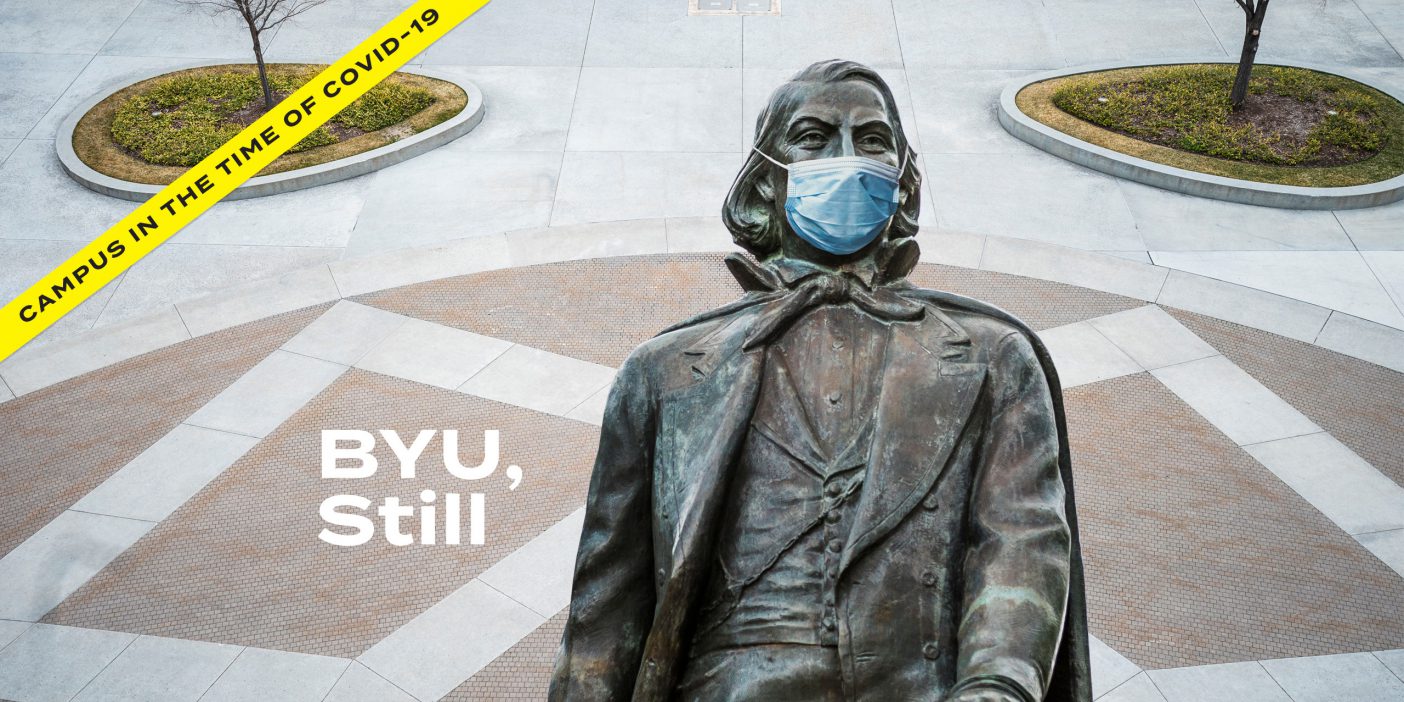
When pandemic concerns swept the nation and BYU canceled on-campus learning on March 12, school officials encouraged students to return home to finish winter semester. Suddenly, BYU’s motto “The World Is Our Campus” took on new meaning.
Not everyone left. “My country [Ecuador] was on lockdown, and no one could fly there,” says international student Amanda D. Galán Vintimilla (’21). Staying in Provo also meant she could continue working.
But even for those who stuck around, it was a winter semester like no other—with sporting and arts events canceled, classes moved online, grading systems adjusted, and social lives disrupted. Here’s a handful of stats to describe the upheaval along with a map of the student exodus.
Campus Ghost Town
4,009 single on-campus student residents (of 5,109, or 78.5 percent) left their housing before semester’s end. Of married student families in on-campus housing, only 117 (11.4 percent) left their dwellings early. BYU provided campus tenants who left early with pro-rated refunds.
Spring Enrollment Bump
13,351 students took spring-term classes—a 28 percent increase over 2019.
Till We Eat Again
Approximately 93 percent fewer guests ate at BYU Dining locations in April compared with a year earlier (about 53,000 vs. 700,000). Chocolate milk consumption dropped by 70 percent. During this time the Cougareat had a limited number of restaurants open at a time to follow increased distancing and sanitation guidelines.

Comfort Food
+68 percent: Half-gallon ice cream sales soared during the pandemic across BYU Creamery locations and other distribution channels.
Weddings Improvised

Of the 55 BYU couples BYU Magazine surveyed who were engaged or planning to get married during COVID-19, 93 percent said they had to alter some aspect of their wedding plans.
After their original plans were disrupted by COVID-19, 18 percent of the responding couples decided to elope, telling no one or very few people.
24 percent of the couples managed to marry in a Latter-day Saint temple, before or after periods when temples closed. 30 percent were married in a house or backyard. Others chose a unique location, including Squaw Peak, the Bonneville Salt Flats, and even the hill beside BYU’s Life Sciences Building.
Taking a Pass

More than 14,000 students chose to use the new pass/withdraw option BYU offered during winter semester only for at least one class. Doing so had no effect on their GPA. Of the more than 125,000 grades given out for all winter-semester classes, approximately 30,000 pass grades or withdraws were taken.
The Great Dispersion
BYU geography professor Brandon S. Plewe (BS ’92) plotted internet service provider locations for attempted logins to the BYU Learning Suite county by county during the last month of winter semester 2020. These represent logins by students, faculty, and others. Even with many students leaving campus, the largest percentage of login attempts came from Utah Valley, including those from faculty and students who remained in Provo.
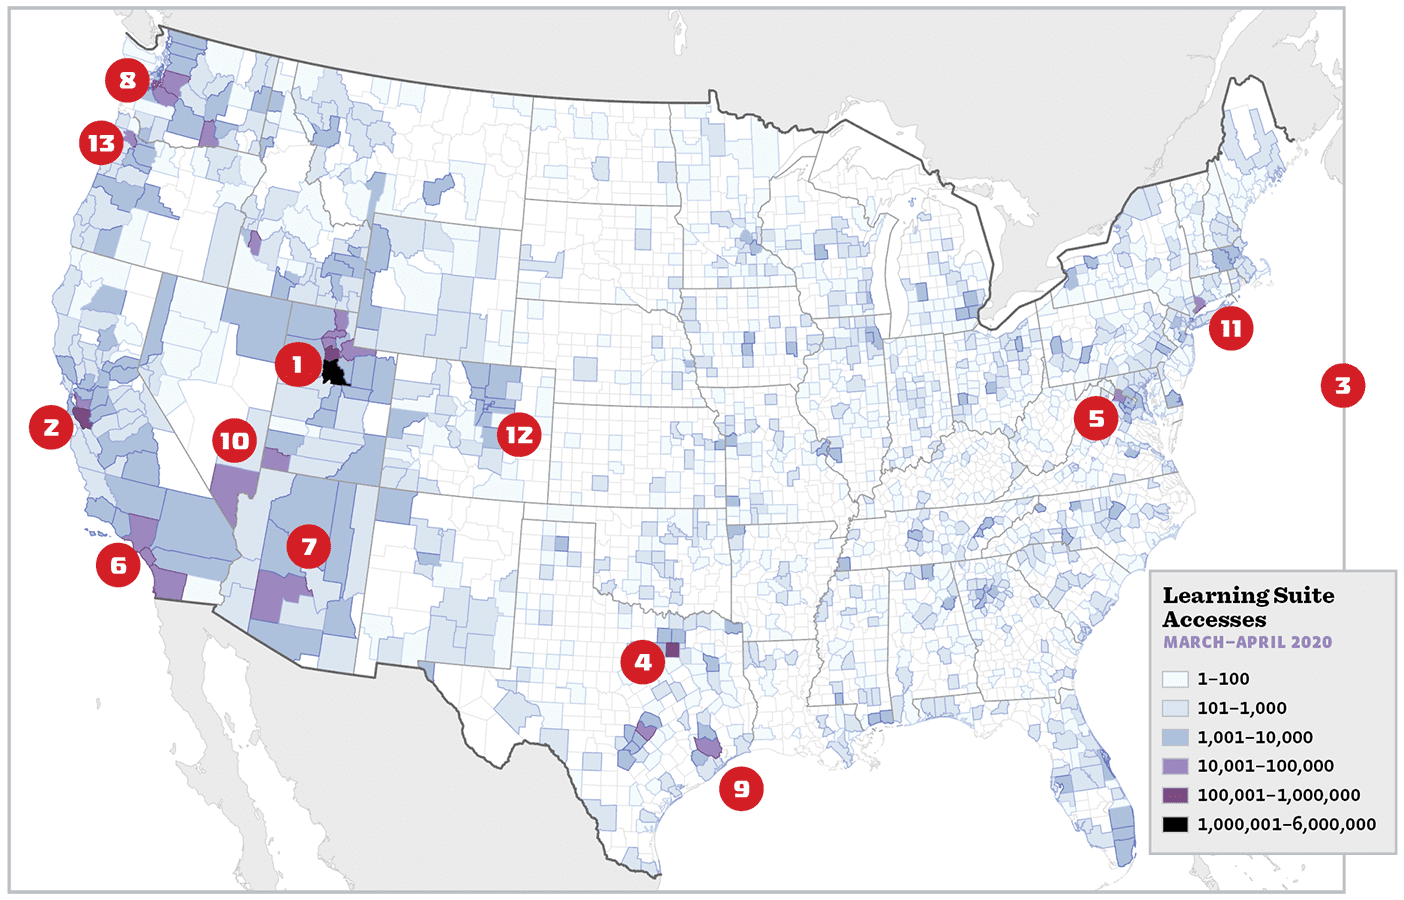
1. Utah Valley: 5,190,000 (68 percent)
2. Bay Area: 223,000
3. International Login Attempts: 150,190
4. Dallas Area: 146,000
5. Washington, D.C., Area: 108,000
6. Los Angeles Area: 106,000
7. Phoenix Area: 68,000
8. Seattle Area: 57,000
9. Houston Area: 47,000
10. Las Vegas Area: 46,000
11. New York City Area: 40,000
12. Denver Area: 35,000
13. Portland Area: 29,000